Where are we losing value?
Revenue grows, profit doesn’t. Management senses that money is leaking somewhere, but not exactly where: in inventory, costings, production or customers. So decisions rest on gut feeling.
Answer: 01 DiagnosticsWe help owners and CEOs of manufacturing companies improve EBITDA, release cash and strengthen competitiveness through focused business transformation programs.
Measured at clients. We report cash and EBITDA separately.
Manufacturers with €5–50 million in revenue are chasing efficiency, new technology and growth at the same time. When these goals don’t reinforce each other, the business spends more energy for less result.
Revenue grows, profit doesn’t. Management senses that money is leaking somewhere, but not exactly where: in inventory, costings, production or customers. So decisions rest on gut feeling.
Answer: 01 DiagnosticsThere are ideas for improvement, but day-to-day work runs them over. Inventory stays high, costs rise faster than sales, and AI projects never get past the presentation.
Answer: 02 PerformanceEntering new markets or making an acquisition takes know-how, time and people that day-to-day operations already consume.
Answer: 03 GrowthThe problem rarely sits in one department. Most often, you need to look at how the business as a whole creates value and turns it into results.
We start with a diagnostic, move on to implementation and grow together. We tie every piece of work to an impact you can see in profit, cash flow or company value.
Four ways to a decision: from one day to a full value map.
Value Mapping reviews the whole business in four weeks. Every opportunity gets a time, a cost and an impact, and released cash is shown separately from EBITDA. If you already know where the problem is, we start narrower: a Day on Site gives an outside view in one day, a Focused Diagnostic examines one area in three to five days, and AI Readiness shows where AI actually pays off and whether your data, processes and people are ready.
Impact: decisions based on numbers, not gut feeling.
Implementation: margin, cash, deliveries, productivity and AI.
We help carry the actions from the diagnostic through to impact. We raise margin on existing sales, release cash from inventory and receivables, fix planning and deliveries, increase manufacturing capacity with the people and equipment you already have, and introduce AI where it saves time or improves decisions. Every action has an owner, a target and a KPI, and we measure the impact in euros.
Impact: higher profitability, more available cash, lower unit cost.
New markets, a steady flow of enquiries and acquisitions.
Once the foundations are solid, we grow outward. We choose markets where your strengths count and build the entry plan. We build a marketing and sales system that brings enquiries from the right buyers every month. For faster growth, we find, value and integrate acquisition targets.
Impact: more revenue without a matching rise in complexity.
We connect the pillars around the opportunities with the biggest impact. We start with a diagnostic and finish when the result shows up in the business.
Book an introductory call→First we find where the business is losing value and what each opportunity is worth.
Armes Diagnostics
Every opportunity in your business gets three numbers: how long it takes, what it costs and what it delivers.
We assess the business from customers and products to manufacturing, planning, procurement, inventory and management. Each opportunity goes on a value map, so one view shows what to do first, what to plan and what not to start.
Cash released is shown separately from profit. Reducing inventory improves cash flow, but its EBITDA impact is small, or even negative when part of the stock is sold below purchase price.
“We knew we had a problem, but we couldn’t put our finger on it.”
Managing director of a food manufacturer, before the project (CS05)
Sample reportArmes Diagnostics report to the board of a plastic parts manufacturer with €22m revenue: €2.3m of cash and €660k of EBITDA a year. Open the sample ↗
| Measure | Weeks | Cost | EBITDA / year | Cash |
|---|---|---|---|---|
| 1. Excess inventory | 10 | 105 k€ | 75 k€ | +1.05 m € |
| 2. Consumption control | 4 | 12 k€ | 150 k€ | – |
| 3. Costing and mix | 8 | 35 k€ | 215 k€ | – |
| 4. Prices, 3 customers | 8 | 8 k€ | 115 k€ | – |
| 5. Scrap, line 2 | 16 | 60 k€ | 135 k€ | – |
| 6. AI for quotations | 12 | 40 k€ | 70 k€ | – |
| 7. AI demand forecast | 30 | 120 k€ | 90 k€ | – |
| 8. DACH market entry | 52 | 250 k€ | 375 k€ | – |
Armes Site Visit
Not sure a diagnostic is worth it? One day at your company shows where the biggest opportunities are.
Within five working days you receive a two-page written summary: 3–5 findings with a rough estimate of potential and a recommended next step.
Sample reportThis is the summary you receive after a Day on Site. A metalworking company with €14m revenue. Open the sample ↗
Book an introductory call →Armes Focus
You know where it hurts? We review only that area and within two weeks show what it is worth and what to do.
We need 4–6 hours of your team’s time. If after the first two days we see that the area does not hold enough potential, we stop and do not charge.
Sample reportProductivity diagnostic for a window manufacturer with €9m revenue: the bottleneck was not where management was looking. Open the sample ↗
Book an introductory call →Armes AI Compass
Before you buy a tool, we check where AI would save time or money in your business and whether your data is ready for it.
Most AI projects do not stall because of the technology, but because of messy data, unclear processes and nobody measuring the effect. Often the first step is good automation, not AI.
We implement the selected use cases as part of 2E AI Implementation.
Sample reportReadiness assessment and pilot plan for a machine builder with €31m revenue. Open the sample ↗
Book an introductory call →We carry the chosen measures through to an effect on profit and cash flow.
Higher margin from the sales you already have. Which of your products are actually losing money?
The answer rarely shows in the income statement: costings are old, overheads are allocated by a key, and discounts and bonuses are spread across invoices and annual agreements. We establish real costs first and only then work on prices. We measure the result in EBITDA on actual monthly results, split into price, volume, sales mix and costs.
Challenges, choose one or two:
What stays when we leave:
In practiceFor a food manufacturer with €17 million revenue, we improved annual EBITDA by €219,600 in two months by correcting product costing and the production mix. The “best” product was actually losing money: after a 20 % price increase it became profitable, and revenue still grew by 8 %. Read the case study ↗
Create a clear and measurable path from current performance to sustainably higher EBITDA.
The cash you need for growth is already on your balance sheet. We release it and set rules so it does not flow back into working capital.
It is tied up in inventory that does not move, in invoices customers pay late, and in supplier payments that go out earlier than necessary. We measure the result in cash in the bank and in days of the cash conversion cycle, and customers do not wait any longer.
Challenges, choose one or two:
What stays when we leave:
In practiceWe released about €700,000 from a manufacturer's inventory in three months. The cash conversion cycle fell from 64 to 52 days. Read the case study ↗
More free cash for growth, and less risk of running short when you need it most.
Reliable deliveries with less inventory. A full warehouse and late orders have the same cause.
Sales, planning, purchasing and production each decide with their own numbers. You pay for the gaps with inventory, rush deliveries and overtime. We measure the result in the share of orders delivered in full and on time, and in the days of inventory you need to achieve it.
Challenges, choose one or two:
What stays when we leave:
In practiceA manufacturer's stock count revealed a €150,000 shortage because material consumption had not been posted for a year. We introduced cycle counting and daily controls that catch errors immediately. Read the case study ↗
A supply chain that serves customers reliably with the least capital tied up and no daily firefighting.
You choose the challenge that costs you most. Together with your team we solve it to a measured target.
At the start we write the target as a number, for example changeover time from 75 to 30 minutes. We work on the shop floor, with your people and without major investment. What works, we write down as a standard so that it stays.
Choose your challenge from:
A production that keeps improving even when you are not on the shop floor.
Supervisors learn to spot problems themselves, find the root cause and remove it the same week. We cascade the board’s targets down to every department, so everyone knows what they measure and why.
We measure in euros and in people:
In practiceAt a food manufacturer, re-measured process times showed that the product that looked best was actually losing money. Once capacity was shifted to more profitable products, revenue grew by 8 % even though that product’s volume fell by 40 %. Read the case study ↗
Build a manufacturing operation that is efficient, flexible and structurally competitive.
Armes AI
AI only counts when it saves time or improves decisions in everyday work.
AI projects often start with the tool, not the problem. A pilot shows what is possible and then stalls, because the data is not in order, the process is unclear or nobody measures the effect. A lot of manual work can be removed with good automation before AI is even needed.
First we check where AI would deliver a measurable effect in your business and whether your data and processes are ready. Then we build the solution around a specific task and track it like any other initiative: in time saved, euros and the quality of decisions.
Typical areas:
In practiceFor an online retailer with €6.4 million revenue, we automated UPN QR payments, reminders and subscription billing: 92 fewer hours of manual work every month, with the investment paid back in 3.5 months. A step like this often prepares the data and processes that AI needs in order to work. Read the case study ↗
“This is a new level of productivity. At our meeting we already discussed the next step, implementing AI, starting with purchasing.”
Head of finance at an online retailer (CS06)
Less manual work and faster, better decisions that show up in your results, not just in a presentation.
Book an introductory call →Once the foundations are solid, we grow in new markets and through acquisitions.
Armes GTM
Revenue growth doesn't happen by itself. It comes from the right customers, in the right markets, with the right message.
We choose markets where demand is proven and your strengths count. We build the entry plan and align it with your production and logistics capacity.
In practiceFor an organic food producer and trader with €13 million revenue, we built a three-year plan to enter six European markets, with a clear role and entry model for each. Read the case study ↗
More revenue from customers and markets that bring margin, not just volume.
Book an introductory call →Armes Marketing
More marketing does not help if the offer is unclear. First we settle who you sell to and what you sell, then we build the route to buyers.
In industrial companies, enquiries often arrive by chance: from trade fairs, agents or referrals. We build a system that brings them in every month and that you can measure from first contact to order.
Illustrative caseA €12.4m maker of food-processing equipment: from 6 to 21 qualified enquiries a month and €3.1m of orders from new customers in one year. Company and figures are composed from typical cases. Read the case ↗
A steady, measurable flow of enquiries from customers who bring margin.
Book an introductory call →Armes Acquisitions
An acquisition can be the fastest route to new customers, technologies and markets. Or the most expensive mistake.
We guide you from strategy to integration: what kind of company to look for, where to find it, what it is worth and how to combine it with yours so the synergies are actually delivered.
Support includes:
In practiceFor an investment group, we screened 1,500 industrial automation companies in four countries in three months, met owners and handed over 9 qualified acquisition opportunities. Read the case study ↗
An acquisition that increases the value of your business: the right choice, at the right price, well integrated.
Book an introductory call →We don’t publish client names. The numbers are real, except in the case marked as illustrative. References are available on request.
inventory shortage found before the sale of the company. Inventory accuracy rose from 90.3% to 98.2%.
Read the case study (PDF)↗released from inventory in three months. The cash conversion cycle fell from 64 to 52 days.
Read the case study (PDF)↗companies screened down to qualified acquisition opportunities in three months, leading to two completed acquisitions.
Read the case study (PDF)↗export revenue in the first year of a three-year plan for six European markets.
Read the case study (PDF)↗annual EBITDA improvement in two months, by correcting product costing and the production mix.
Read the case study (PDF)↗of manual work removed every month across 1,300 invoices. The investment paid back in three and a half months.
Read the case study (PDF)↗qualified enquiries a month and €3.1m of orders from new customers in one year.
Read the case (PDF)↗This is what the board receives. The companies and figures are fictitious, built from typical cases.
of cash and €660k of EBITDA a year for a plastic parts manufacturer, with no new investment.
Open the sample (PDF)↗of EBITDA a year hidden in pricing, a bottleneck and overtime at a metalworking company.
Open the sample (PDF)↗capacity for a window manufacturer without buying a €1.2m CNC line. The bottleneck was the paint shop.
Open the sample (PDF)↗out of 100 in four steps for a machine builder that bought Copilot licences but does not use them.
Open the sample (PDF)↗“Had we not dealt with this on time, the sale might not have gone through.”
We identify where value is being lost or where potential remains untapped.
We translate the most important opportunities into measurable financial or operational impact.
We focus management attention on the few initiatives that matter most.
We define actions, ownership, timelines and performance measures.
We stay with you until the result shows in the P&L or cash flow.
The value of transformation is created through execution. We work alongside management to turn findings into concrete initiatives and drive them through to measurable impact.
During implementation we take care of:
Our principleAn improvement only counts once its impact is visible in the P&L, cash flow or operational performance.
Most businesses do not suffer from a lack of ideas.
Every major initiative should have a clear impact on EBITDA, cash, growth or enterprise value.
Solutions must work in the real operating environment, not only in a presentation.
Transformation is not a report. It is a measurable change in how the business operates and performs.
We create the most value for manufacturing businesses with €5–50 million in annual revenue, that:
Armes combines operational understanding, financial and analytical insight, leadership capability and M&A experience. We identify where value is being lost, define what needs to change and help turn change into measurable results.
You create value. We help you get more from it.
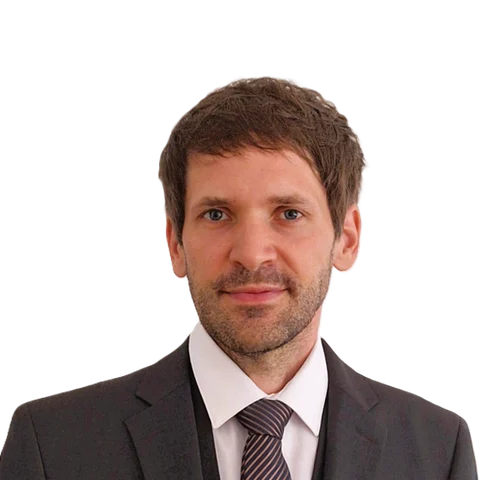
Founder of Armes, Performance & Growth Consultant
More than 10 years of experience in supply chain and manufacturing, including the global electronic components industry. He has led Purchasing, Planning and Logistics and coordinated material flows across internal factories, remote manufacturing locations and contractors. He combines hands-on operational leadership with strong analytical skills and deep SAP S/4HANA expertise, and aligns suppliers, manufacturing, engineering, logistics and finance. He gained M&A experience at Bourns and has built on it through acquisition projects at Armes.
Igor leads every project personally. For AI implementation and other specialist areas, he brings in trusted partners. He runs no more than two projects at a time, so start dates are confirmed in advance.
Education and training: Faculty of Civil and Geodetic Engineering, University of Ljubljana (EQF 7); REFA course, production controlling, Karrass Effective Negotiating. Languages: Slovenian, English, Croatian, German.
LinkedIn profile↗Consultants usually bill for their time and leave with a report. At Armes, the price is tied to the expected effect, and we stay with you until it shows in profit or cash flow.
Consultants usually bill hours or days, whatever the project delivers. At Armes, implementation is priced against the expected effect of the measures. The aim is a ratio between investment and effect of at least 1 : 5: at least five euros of effect for every euro you invest.
Since 2012 in planning, controlling and supply chain management at Bourns, Belimed and within the Bosch group.
Igor leads every project personally and runs no more than two at a time. No hand-over to junior staff, no new faces at the second meeting.
We do not stop at a report. We help implement the measures until the result shows in profit or cash flow. Six case studies prove it with measured figures.
Pick a time in the calendar and answer three short questions: revenue, industry and main challenge.
Free of charge. We check which step makes sense for your business: a Day on Site, a Focused Diagnostic, AI Readiness or Value Mapping, and what data we need.
Fixed price, scope, timeline and a non-disclosure agreement (NDA).
Once the proposal is signed, we schedule a kick-off with your team.
We present the results to your management. You decide whether we continue with implementation.
When we are not the right choice: if you are not ready to implement, or if your management team cannot set aside 10–12 hours over the next month.
Why the warehouse fills up again after a one-off inventory write-off, and six steps that prevent it: master data, posting movements, cycle counting, BOM standards, S&OP and excess and obsolete stock.
Reducing inventory releases cash, but EBITDA usually falls in the year of the reduction. Three traps, a case from practice, a board table and six steps to keep the warehouse from filling up again.
In 30 minutes, we can explore which challenges and opportunities deserve the most attention and whether there is a strong basis for working together.
Book an introductory call→A 30-minute conversation about your priorities and the potential for working together. The button opens a booking calendar.