
Less inventory, more cash, but not more profit
What reducing inventory does to cash, what it does to EBITDA, and how to show it honestly to the board

In its latest working capital study (Working Capital Study 24/25, more than 19,000 listed companies worldwide), PwC estimates that €1.56 trillion of excess working capital is tied up in businesses. Days inventory outstanding have deteriorated since 2019 in six of the eight sectors analysed in more detail. In the authors' words, for some companies "just in case" stock has turned into "just because" stock.
The figure is large because the companies are large. But we see the same pattern in Slovenian manufacturers with €5–50 million in revenue: the warehouse is fuller than before the pandemic, most of the reasons for it have gone, and the stock has stayed.
When the board decides to reduce inventory, it often expects two things at once: more cash and a better result. The first almost always happens. The second often does not: in the year of the reduction, EBITDA falls in most cases. That is not a failure of the project, it is accounting. If nobody explains it in advance, a successful project gets declared a failure at year end.
Three accounts, one decision
An inventory reduction shows up in three places, and each tells you something different.
Cash (balance sheet and cash flow). When you use or sell material and do not replace it, the cash stays in the business. This is a one-off effect: reducing inventory by €500,000 releases €500,000 once, not every year.
EBITDA (income statement). Inventory is not a cost until the material goes into a sold product or you write it off. So reducing inventory by itself barely affects EBITDA. What affects it is what happens during the reduction: the price at which you sell the surplus, how much you write off and how much less you produce.
Net profit. If you use the released cash to repay a loan, you save interest. But interest sits below the EBITDA line. The saving is real, but you will not see it in EBITDA.
Why EBITDA usually falls in the year of the reduction
Inventory is almost never reduced only by using good material. Almost every serious project hits at least one of three traps, and companies holding their own finished goods often hit all three.
1. Selling surplus below purchase cost. Material nobody needs rarely fetches full price. The difference to book value is a loss in the year of sale, even though the company receives cash.
2. Write-offs and impairments. When a company reviews its inventory seriously for the first time, it usually finds material that is no longer usable. The loss already existed, it just had not been recognised. A reduction project brings it into the income statement all at once.
3. Fixed costs "parked" in inventory. This is the least known and often the largest effect. Under accounting standards (IAS 2 and the Slovenian SRS 4 Inventories), the value of own products includes part of fixed production overheads, such as machine depreciation, supervisors' wages and maintenance. While you build finished goods stock, part of these costs stays on the balance sheet. When you reduce it and produce less than you sell, the costs from earlier periods flow into this year's income statement.
Illustration: a company reduces finished goods stock by 10,000 units. Each unit carries €12 of fixed production overhead. In the year of the reduction, €120,000 of costs created in previous years appears in the income statement. Nobody spent any cash, but the result is lower.
Where EBITDA really gains
Once the reduction is complete, the picture turns. The lasting effect of lower inventory on EBITDA is positive, but smaller than boards often imagine:
- less external or rented warehouse space,
- fewer moves, searches and stock count differences,
- less obsolescence and fewer write-offs in future years,
- lower inventory insurance.
These savings have to be calculated for your business, not taken as a generic percentage from the literature. In some companies they matter, in others they are close to zero.
A case from practice: two results, shown separately
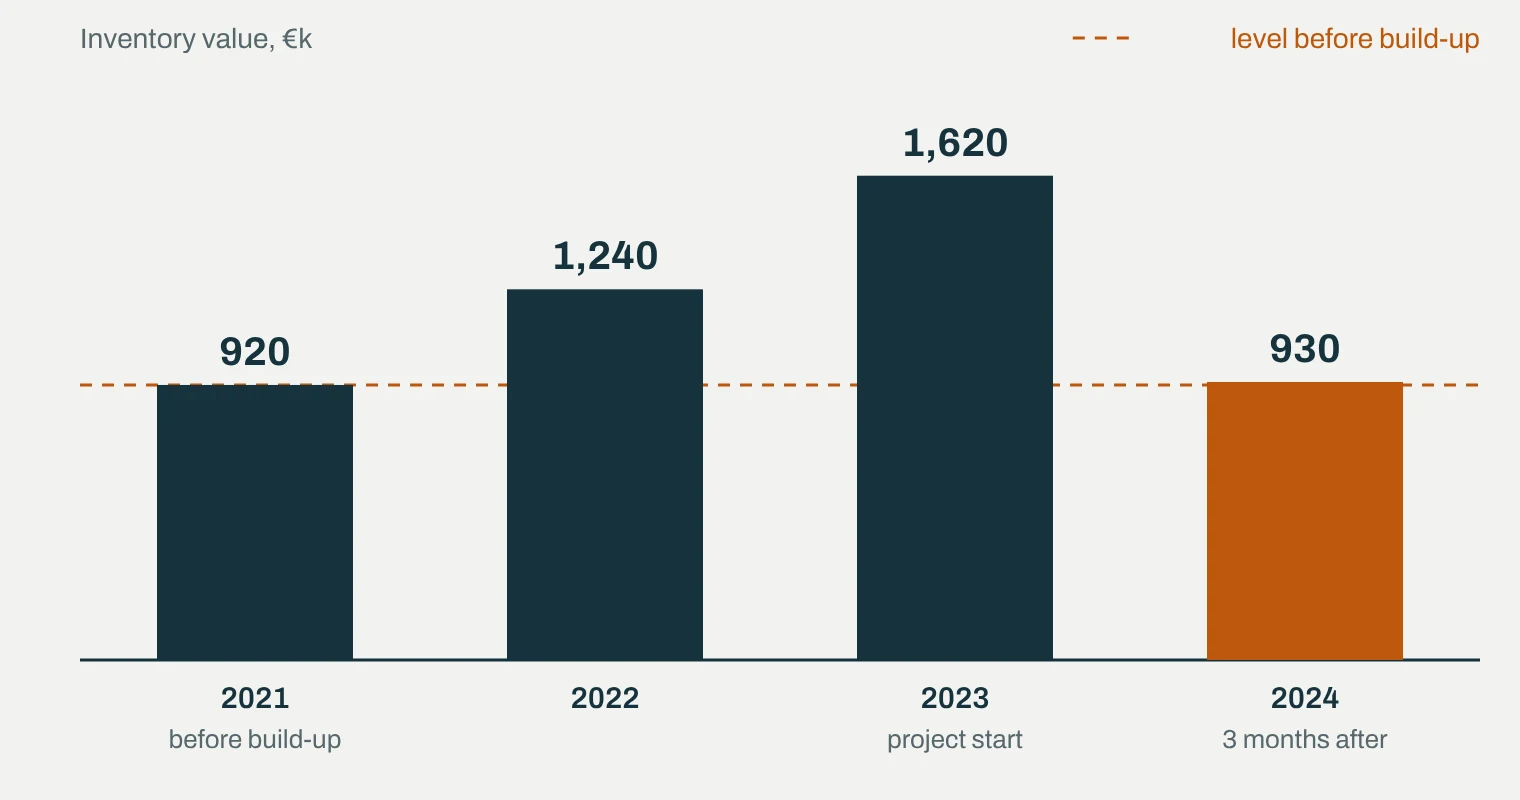
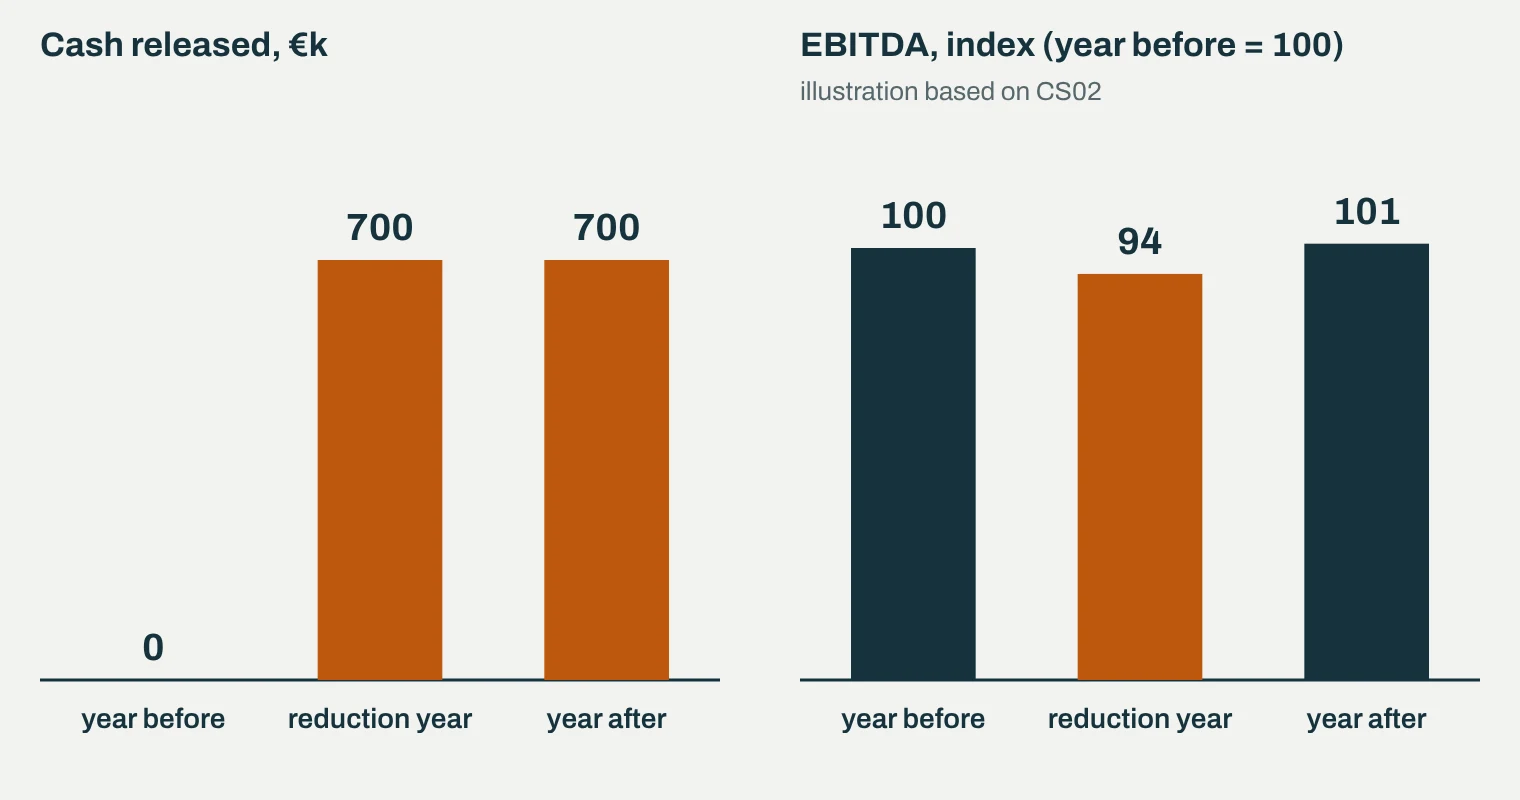
An electronic components manufacturer with €14m revenue released €700,000 of working capital in three months (case study CS02). It decided on the surplus item by item. €610,000 of material was sold instead of written off. Raw materials went at 80% of purchase cost, copper at 12% above it, because market prices had risen in the meantime. €50,000 was used in production and only €40,000 written off.
So we showed the board two separate results. EBITDA fell by 6% that year. But the company needed cash for investments and got it from its own warehouse instead of from the bank. Below the EBITDA line, this meant €35,000 of interest saved over the investment period. The cash conversion cycle shortened from 64 to 52 days.
Had the board judged the project on EBITDA alone, it would have called it a failure, since EBITDA fell by 6%. Had the €700,000 of released cash been added to profit, it would have looked like a much bigger success than it was. Only the two numbers together, each in its own column, give the true picture.
So the warehouse does not fill up again: keeping inventory right for good
A one-off reduction is easy. What is hard is making sure the numbers in the system still match the warehouse a year later. Without that, surplus and write-offs come back, and management decides on stock that does not really exist. Keeping inventory right for good rests on six steps:
- Master data and planning parameters. Safety stocks, minimum order quantities, lead times and reorder points in the ERP must reflect today's reality. If they are outdated, the system correctly calculates the wrong purchase.
- Systematic posting of every movement. Consumption, scrap, rework, samples, returns: every material movement is posted when it happens, not at month end from memory.
- Cycle counting. Instead of one annual stock count, the warehouse is counted continuously, in parts, and most often where value is highest. Differences are found in the week they arise, not at year-end closing.
- Correct consumption standards in bills of materials. Steps 2 and 3 are the basis for this step. Once movements are posted and stock is verified, consumption can be tracked by product and compared with the standards, which are then gradually corrected to actual consumption. This matters most for expensive materials, where even a small difference per unit adds up to a large amount over a year.
- Aligned purchasing, production and sales plans: S&OP. Most surplus arises because purchasing buys to its plan while sales promises to its own. The key role belongs to a monthly sales and operations planning (S&OP) process, where sales, planning, purchasing and finance agree one demand number and derive one purchasing and production plan from it.
- Managing excess and obsolete inventory. Every surplus or obsolete item has an owner and a deadline for a decision: use, sell, return to the supplier or write off. The review is regular, for example monthly, not only when the warehouse runs out of space.
Correct standards are not just a warehouse topic. They drive costings, the purchasing plan and MRP proposals. If they are wrong, the system buys too much or too little, and product prices rest on consumption that does not exist. The stock count differences this causes at year end go straight into EBITDA.
We describe the whole process, from master data to managing excess and obsolete materials, together with our experience from practice, in Inventory management: from master data to excess and obsolete materials.
What this means for your business
Small companies (up to €10m revenue). Cash often matters more than EBITDA. Released cash reduces dependence on the revolving credit line and supplier terms. Costings often do not include fixed costs in inventory, so the third trap is smaller. The first and second remain.
Mid-sized companies (€10–50m revenue). Banks often track net debt to EBITDA. Reducing inventory improves this ratio through lower net debt, even if EBITDA stays the same. But if EBITDA falls in the year of the reduction because of write-offs or fixed costs, the ratio can temporarily worsen. It makes sense to inform the bank in advance.
Companies in a group or with an owner who watches the annual result. Start the project by agreeing what is measured. If management's bonus is tied to EBITDA, inventory reduction will always lose to "let's wait a little longer".
Companies preparing for a sale. Here inventory reduction is a double-edged sword. In due diligence, the buyer and its advisers usually look at EBITDA over the last three years, and the company's price is often a multiple of that EBITDA. Write-offs and selling surplus below cost during this period reduce EBITDA and so possibly the price. On the other hand, the buyer always finds untidy inventory: stock count differences, obsolete stock and wrong consumption standards get deducted from the price or covered by warranties. So put inventory in order as early as possible, ideally more than three years before a sale. If that is not possible, document write-offs and surplus sales clearly as one-off items, so the buyer can exclude them in normalised EBITDA.
A simple framework: the board table
| Action | Cash | EBITDA | Net profit |
|---|---|---|---|
| Using surplus in production | + one-off | ≈ 0 | ≈ 0 |
| Selling surplus below purchase cost | + one-off | − one-off | − one-off |
| Writing off unusable stock | 0 | − one-off | − one-off |
| Producing less for finished goods stock | + one-off | − one-off (fixed costs) | − one-off |
| Less warehousing, moves, obsolescence | + lasting | + lasting | + lasting |
| Repaying a loan with released cash | − (repayment) | 0 | + lasting (interest) |
Give each action its own row in the plan and its own number in every column. That way the board knows in advance what it will see on the balance sheet and what in the income statement.
Five questions for your business
- Is your inventory target set in cash, in EBITDA or in both, and does everyone in management understand the difference?
- How much fixed production overhead sits in your finished goods stock today?
- What is the ratio between the book value of your surplus and the price you would get for it on the market?
- Does your bank track net debt to EBITDA, and does it know you are planning to reduce inventory?
- Do the consumption standards in your bills of materials match actual consumption, and when did you last check them for your most expensive materials?
Where to start
Start with the table above, filled in for your 20 largest surplus items. In the first week of Value Mapping, we show released cash and EBITDA effect separately for every opportunity, so the board decides on both numbers.
Sources: PwC, Working Capital Study 24/25 (pwc.co.uk/working-capital-study); IAS 2 Inventories, paragraph 13; SRS 4 (2024) Inventories; Armes, case study CS02.
Case study: Working capital (PDF) ↗
Inventory management: from master data to excess and obsolete materials
Why the warehouse fills up again after a one-off inventory write-off, and six steps that prevent it: master data, posting movements, cycle counting, BOM standards, S&OP and excess and obsolete stock.
AI: adopt fast, or first protect what sets you apart?
Alex Karp says model providers are "stealing the alpha" of businesses. What really happens to data, what it means for small, mid-sized and micro businesses, and five steps to adopt AI without losing know-how.