
Five supply chain KPIs: from the ASCM standard to the board meeting

ASCM (Association for Supply Chain Management, formerly APICS), the largest professional association for supply chain management, uses the SCOR model to assess a supply chain on five attributes: reliability, responsiveness, agility, cost and asset management. For each it defines strategic metrics a company uses to measure how well it achieves its market position against the competition. The standard is clear. In practice, though, most manufacturing businesses have plenty of supply chain numbers: warehouse occupancy, number of delivery notes, freight cost per tonne, inventory turns by material group. Yet in the board meeting one question still has no clear answer: is the supply chain working for the business or against it?
Three numbers answer it, each matching one attribute of the standard. One tells you whether customers get what they ordered (reliability). The second tells you how much cash it takes (asset management). The third tells you what it all costs (cost). ASCM itself stresses that the right metrics depend on the operating environment. So we add two more, which ASCM covers under demand forecasting and sourcing. They tell you what will happen to the first three in a few weeks: how well the business knows what customers will order, and how reliably its suppliers deliver.
Why these five
A supply chain has to meet three demands at once, and they pull against each other: customer service, cash and cost. Each is easy to improve if you sacrifice the other two.
- More inventory almost always means better delivery. But cash sits on the shelves.
- Less inventory releases cash. But customers start waiting and production changes over for every small batch.
- Full trucks and large batches lower the cost per unit. But inventory grows and deliveries become less frequent.
That is why a single KPI is not enough. A department measured on one will optimise that one at the expense of the other two. Only all three together show whether an improvement is real or the problem has just been moved somewhere else.
The first three KPIs are chosen on three criteria:
- They measure outcomes, not activity. Customers do not care how you plan; they care whether the goods arrived. Owners do not care about the turns of one material group; they care how much cash is tied up.
- They cover the whole chain, not one department. At least five functions influence each of them, so no single department can "fix" it alone.
- They connect to the financial statements. The first drives revenue, the second cash flow and the balance sheet, the third EBITDA.
Outcomes have one weakness: they show a problem only once it has happened. So we add two KPIs that measure the inputs to the chain that the business does not fully control: customer demand and supplier deliveries. Every bit of uncertainty on these two inputs turns into one of three things inside the business: extra inventory, late deliveries, or express freight and overtime. When forecast accuracy or supplier reliability gets worse, OTIF, the cash conversion cycle or cost will follow a few weeks later. That is when acting is still cheap.
1. OTIF: do customers get what they ordered
OTIF (On Time In Full) is the share of orders delivered on the date the customer requested, in full quantity.
OTIF = orders delivered on time and in full ÷ all orders delivered
What it shows. How reliable the business is in the customer's eyes. For industrial customers this often matters more than price: a customer whose supplier stops their line more than once will find another one, even a more expensive one. Low OTIF shows up in revenue with a delay, so it pays to watch it earlier.
Which areas it covers. The whole path of an order: order entry and confirmation, planning, material purchasing, production, quality control, warehouse and shipping, transport to the customer.
Who influences it.
- Sales, when it confirms a date production cannot meet or accepts a rush order outside the plan.
- Planning, when the plan ignores the real capacity of the bottleneck.
- Purchasing, when material arrives late or in the wrong quantity.
- Production and maintenance, through downtime, changeovers and scrap.
- Quality, when a batch is stuck in inspection.
- Warehouse and logistics, through picking errors and missed collections.
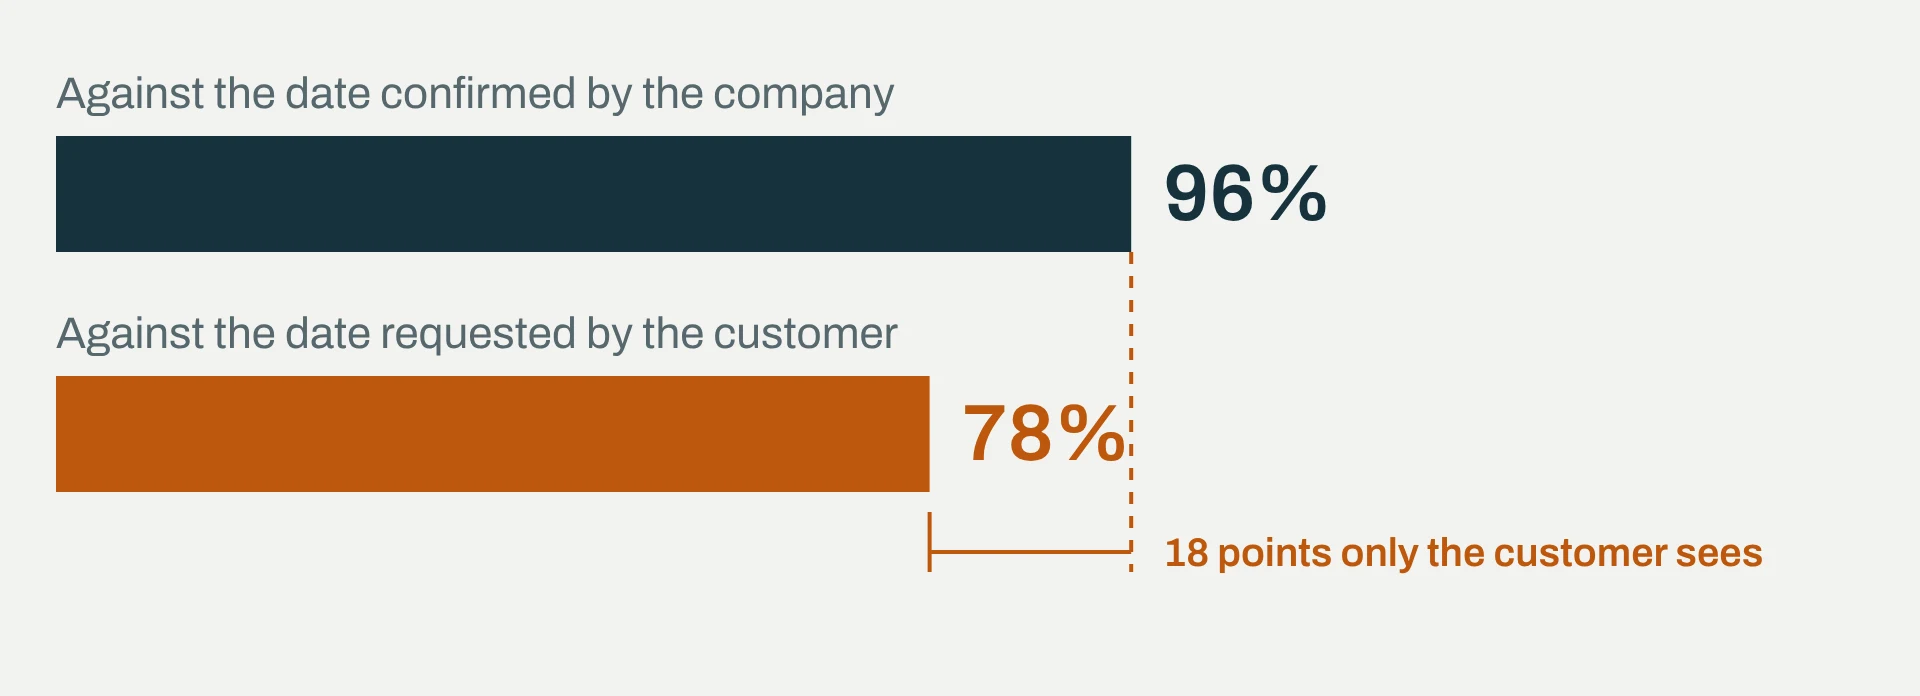
The most common trap. OTIF measured against the date the business confirmed rather than the date the customer requested. If the date is moved at confirmation, the delay is never recorded. An example with round numbers: a business reports 96% on-time deliveries, but against the requested date it is 78%. Both numbers are "correct", but only the second is the one the customer sees. ASCM is unambiguous here: what counts as "on time" has to be defined by the customer. Its stricter metric, perfect order fulfillment, also requires correct documentation and undamaged goods on top of on-time and in-full. OTIF is enough to start with; the perfect order is the next step. The second trap is measuring by line instead of by order: an order with ten lines, one of them missing, is an incomplete order to the customer, not a 90% success.
2. Cash conversion cycle: how many days your cash is on the road
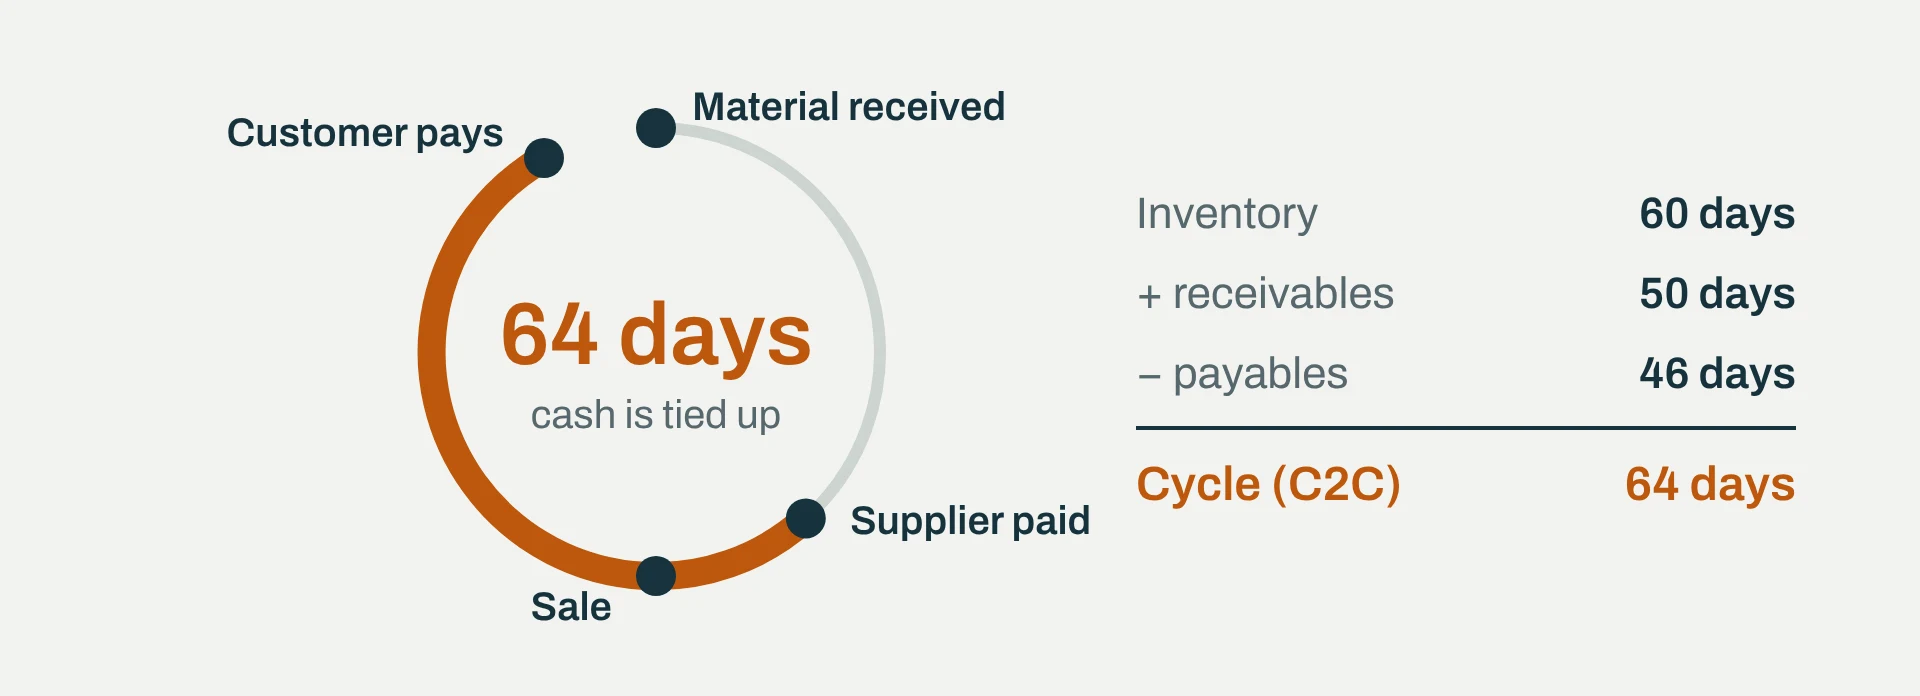
The cash conversion cycle (cash-to-cash cycle) tells you how many days pass from the moment the business pays its supplier to the moment the customer pays the business.
Cash conversion cycle = days of inventory + days of receivables − days of payables
What it shows. How much working capital the business needs to operate. Every day of the cycle is cash that has to be financed from equity or debt. For a business with €15 million revenue, one day of the cycle is about €41,000 of tied-up cash.
Important: shortening the cycle brings cash, not profit. Lower inventory shows up in cash flow and the balance sheet, not in EBITDA. That is why it must always be reported separately from cost savings. Anyone who adds the two together will have the wrong picture of what a project delivered.
Which areas it covers. This is the only one of the five that connects the supply chain with finance. In the SCOR model it is the main asset management metric:
- days of inventory are in the hands of purchasing, planning and production,
- days of receivables are in the hands of sales and finance,
- days of payables are in the hands of purchasing and finance.
In a manufacturing business, days of inventory are usually the largest and most controllable part of the cycle.
Who influences it.
- Purchasing, through minimum order quantities, "just in case" buys and payment terms with suppliers.
- Planning, through batch sizes and safety stocks nobody reviews.
- Production, through work in progress waiting in front of the bottleneck.
- Sales, through the payment terms it promises customers and products it offers but does not sell.
- Finance, through collections and paying suppliers.
- Engineering, when it changes a product and material for the old version is left behind.
The most common trap. The cycle is shortened by paying suppliers later. The number improves, but suppliers raise prices or put you at the back of the queue when material is short. Lasting improvement comes from inventory, not from paying late.
From practice. A manufacturer of electronic components with €14 million revenue shortened its cash conversion cycle from 64 to 52 days and raised inventory turns from 5.8 to 8.2 a year. It released €700,000 of working capital, and inventory returned to its level before the build-up.
3. Supply chain cost as % of revenue: what it all costs
Total supply chain cost is every cost incurred to bring material into the business, turn it into a product and get it to the customer, expressed as a share of revenue.
Supply chain cost % = (purchasing and planning + warehousing + internal and external transport + inventory write-offs + exceptional costs) ÷ revenue
ASCM calls this total supply chain management cost and acknowledges that assigning costs to processes is the hardest part of the calculation. We deliberately leave out the cost of capital tied up in inventory, because the cash conversion cycle already shows it.
What it shows. How much EBITDA the supply chain itself consumes. The number is most valuable as a trend: if revenue grows 10% and supply chain cost 20%, the chain is not growing with the business.
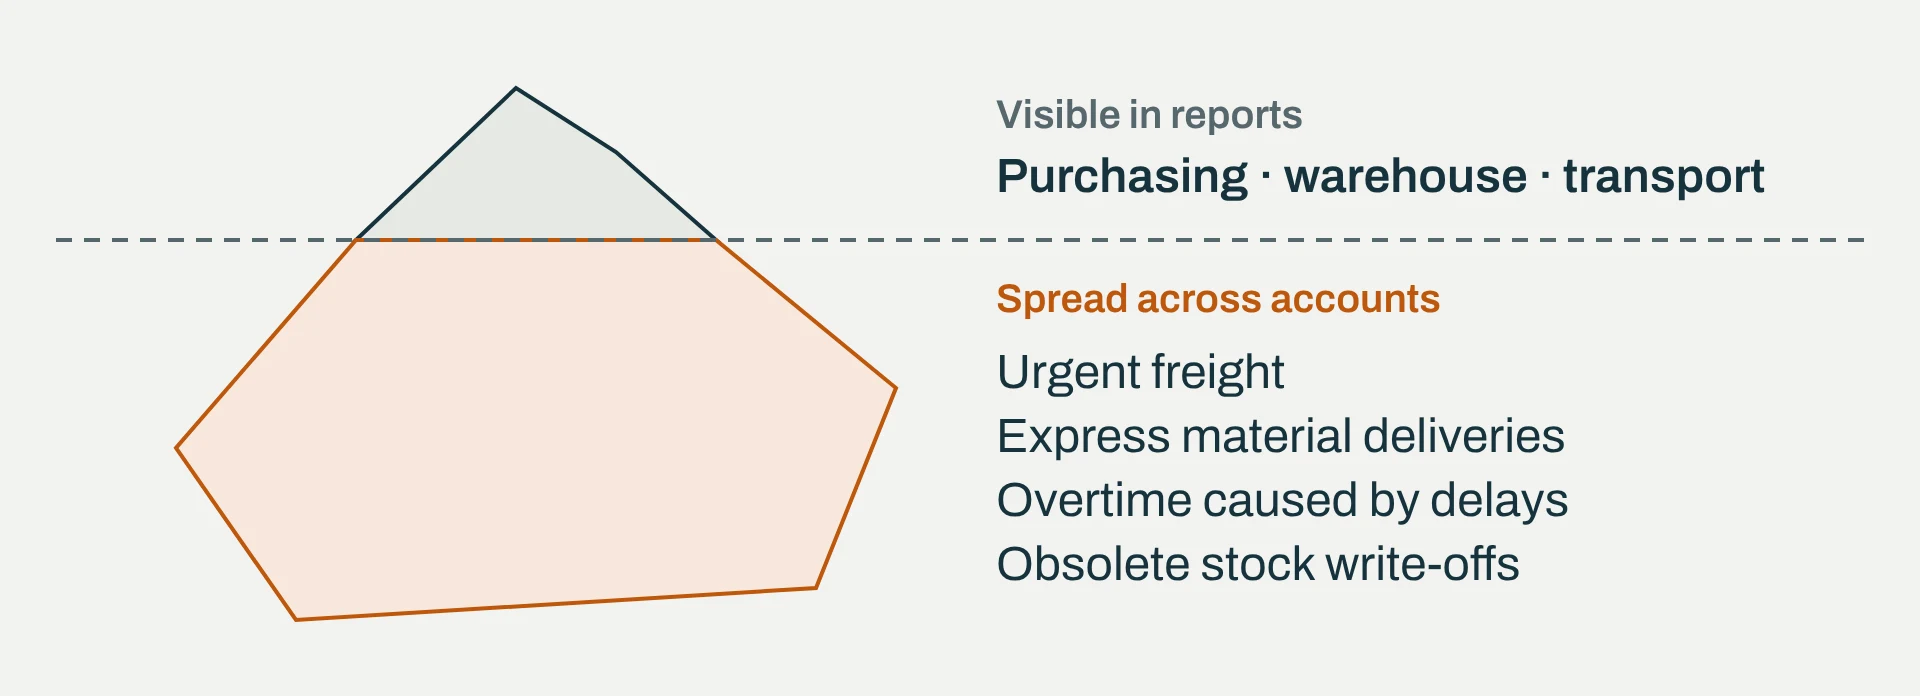
Which areas it covers. Purchasing, planning, warehouses, internal logistics, shipping, external carriers and customs. The most interesting part, though, is exceptional costs, which most reports never collect in one place: express freight, rush material deliveries, overtime due to delays, extra changeovers due to plan changes, write-offs of obsolete stock. These are the costs of poor planning, but they are booked as transport, production or purchasing costs, so nobody sees them together.
Who influences it.
- Logistics and warehouse, through the use of space, people and transport.
- Purchasing, through freight rates and supplier choice (a nearer supplier is often more expensive per unit and cheaper overall).
- Planning, because every unplanned change means express freight or overtime.
- Sales, through the delivery terms it promises (frequent small deliveries, free delivery, special packaging).
- Engineering, through packaging and the number of product variants.
The most common trap. Freight cost per unit goes down because shipments wait for a full truck, while inventory grows and OTIF falls. Or the other way round: the warehouse gets cheaper with less stock, but that requires express freight. That is why we never look at this KPI without the other two.
4. Forecast accuracy: how well the business knows what customers will order
Forecast accuracy tells you how close the sales forecast was to actual demand, by item.
Forecast accuracy = 1 − sum of |forecast − actual| ÷ sum of actual demand
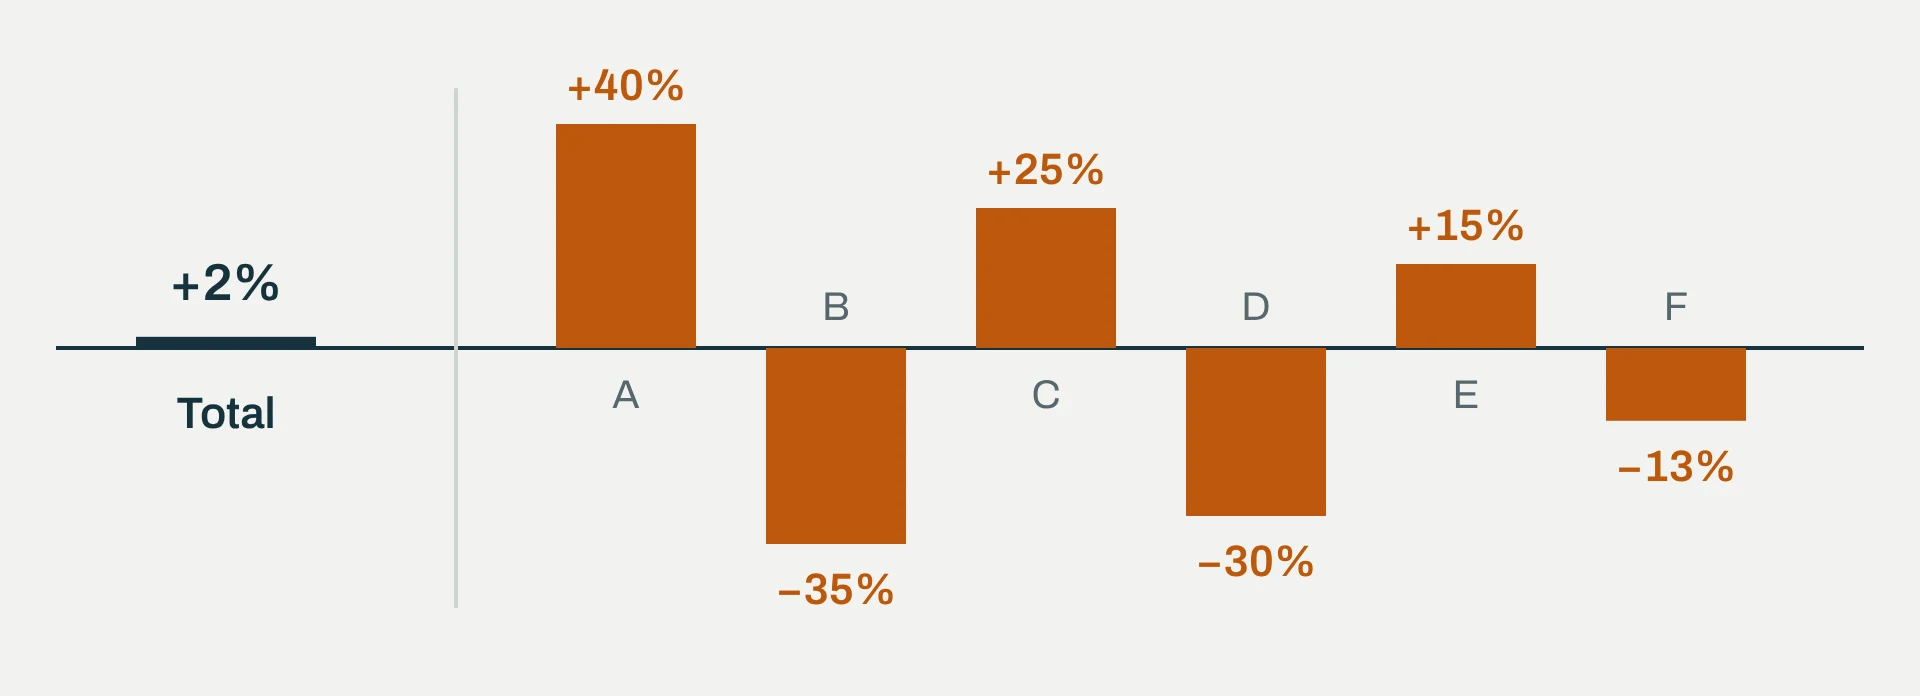
It is calculated by item and month, and the deviations are added in absolute value so that over- and under-forecasts do not cancel out.
What it shows. How much uncertainty the supply chain has to absorb on its own. Every percentage point of inaccuracy shows up somewhere: as safety stock someone holds "just in case", or as a plan change that costs a changeover, overtime and express freight. Forecast accuracy is therefore the cause we most often find behind poor OTIF and an overly long cash conversion cycle at the same time.
Which areas it covers. Sales and key account management, marketing, sales and production planning, and the alignment between them where the business has it (a monthly S&OP meeting, Sales and Operations Planning).
Who influences it.
- Sales, which prepares the forecast and knows the customers best. Often the forecast is also the sales target, so it is systematically too high.
- Marketing, through promotions and new products that planning hears about too late.
- Planning, which turns the forecast into a plan and has to check it every month.
- Customers, who share their forecasts or not. With industrial customers, an agreement to share forecasts is often the cheapest improvement.
- Management, when it requires the forecast to match the budget.
The most common trap. Accuracy measured at total revenue level. A forecast can be accurate to 2% in total and wrong by 40% item by item, because over- and under-forecasts cancel out across items. But production does not make revenue, it makes items. The second trap is measuring the last forecast before delivery. What counts is the forecast that was valid when material had to be ordered, one lead time earlier. The third trap is bias: if the forecast has been too high six months in a row, that is not inaccuracy but a habit, and it should be treated as one. ASCM measures it with the tracking signal, which shows whether the forecast keeps missing in the same direction.
5. Supplier reliability: does the business get what it ordered
Supplier reliability is OTIF in the other direction: the share of purchase orders suppliers delivered on the date the business requested, in full quantity and in the right quality.
Supplier reliability = purchase orders delivered on time, in full and without a complaint ÷ all purchase orders received
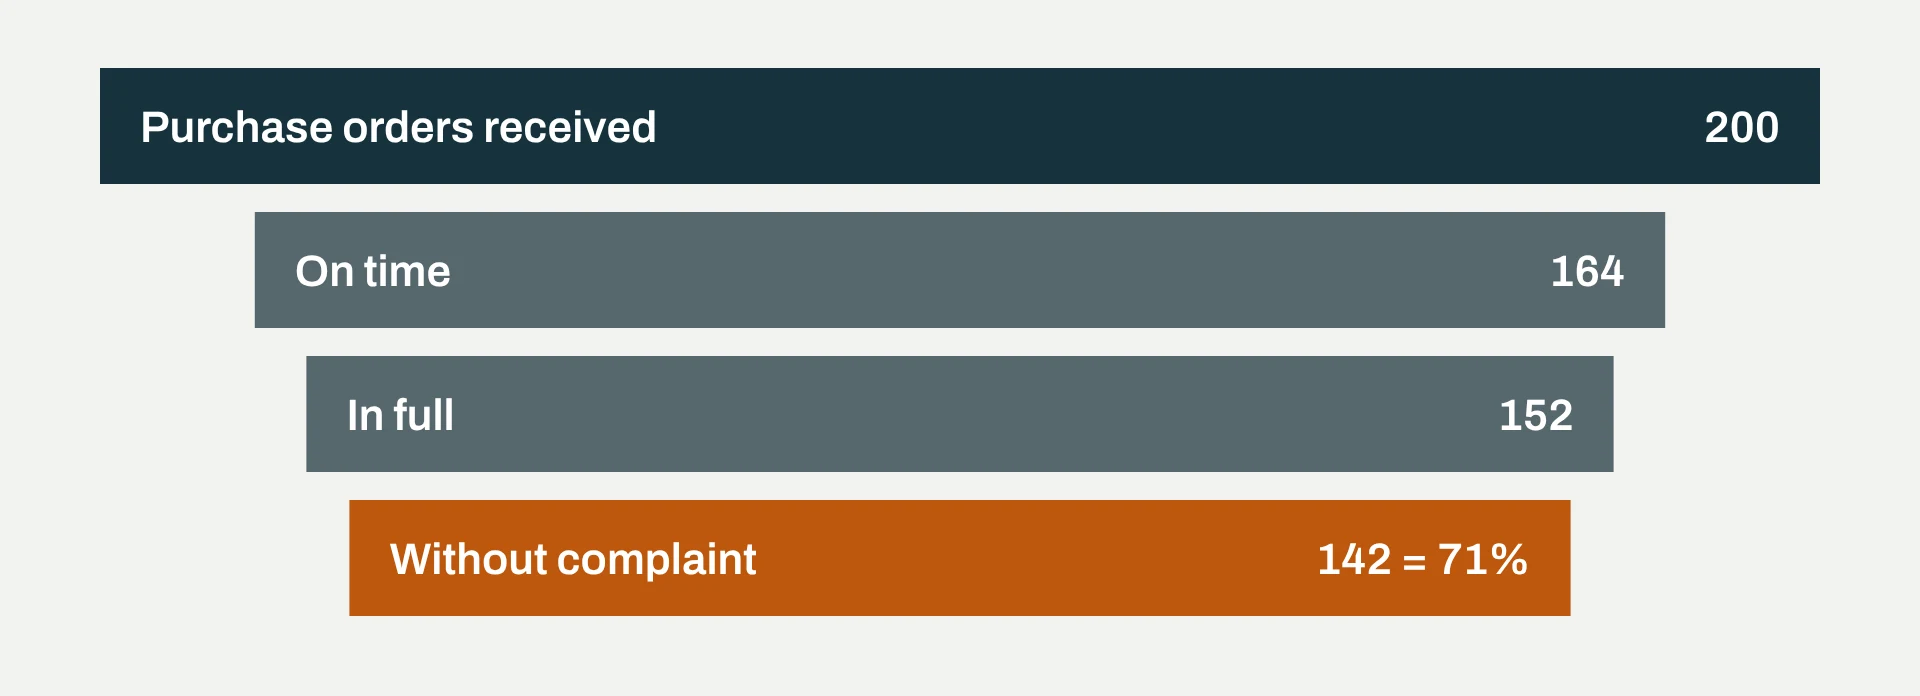
What it shows. How much uncertainty enters the business from the supply side. A supplier who is a week late on average forces the business to hold an extra week of stock or risk being late to its customer. The KPI therefore tells you how much safety stock is justified and how much is just habit. It is worth tracking by supplier: usually a handful of suppliers cause most of the delays.
Which areas it covers. Purchasing, goods receipt and incoming inspection, the warehouse and material planning.
Who influences it.
- Purchasing, through supplier selection, agreed lead times and regular supplier performance reviews.
- Planning, when it orders too late, with a shorter lead time than agreed.
- Quality, through incoming inspection and complaints, which have to be recorded to count at all.
- Warehouse, which has to record the actual receipt date, not the posting date.
- Finance, because a supplier the business pays late will serve others first when material is short.
The most common trap. Supplier delays caused by the business itself. If a purchase order goes out with three weeks' notice when six were agreed, the delay is not the supplier's, it is planning's. So every delay needs to be checked for whether the date was realistic. The second trap is that nobody measures the KPI, because the ERP only records the receipt posting date. The third is measuring against the date the supplier confirmed rather than the date the business requested. It is the same mistake as with customer OTIF, just in the other direction.
Who influences what
| Function | OTIF | Cash conversion cycle | Supply chain cost | Forecast accuracy | Supplier reliability |
|---|---|---|---|---|---|
| Sales | ●●● | ●● | ●● | ●●● | ● |
| Marketing | ● | ● | ● | ●● | — |
| Planning | ●●● | ●●● | ●● | ●● | ●● |
| Purchasing | ●● | ●●● | ●●● | ● | ●●● |
| Production | ●●● | ●● | ●● | — | — |
| Quality | ●● | ● | ● | — | ●● |
| Warehouse and logistics | ●● | ● | ●●● | — | ● |
| Finance | ● | ●●● | ● | ● | ●● |
| Engineering | ● | ●● | ●● | ●● | ● |
| Management | ● | ● | ● | ●● | ● |
●●● strong influence · ●● medium · ● small · — practically none
The table shows something an organisation chart does not: at least four functions influence each KPI, and sales and planning influence all five. If you hand a KPI to one department, that department becomes responsible for something it cannot control alone. So each KPI has one owner who tracks it and calls for action, but the target is shared by every function that influences it. Typically the owner of OTIF is the head of production or supply chain, the owner of the cash conversion cycle the CFO, the owner of supply chain cost the head of logistics, the owner of forecast accuracy the head of sales (not planning, because the forecast is made in sales), and the owner of supplier reliability the head of purchasing.
What about order fulfilment cycle time and inventory turns?
Both matter, but at a different level. Order fulfilment cycle time (OFCT), the time from receiving an order to delivering it, is the only strategic responsiveness metric in the SCOR model, measuring the speed of the chain. It complements OTIF well, because OTIF does not tell you how long the customer waited: a business can have excellent OTIF simply because it promises long lead times. Where lead time is the main reason you win or lose business, it is worth tracking alongside OTIF. The SCOR agility metrics, such as how much more the chain can deliver within 30 days, are hard for a smaller company to measure monthly; assessing them once a year makes sense. Inventory turns are days of inventory written differently, and those are already part of the cash conversion cycle. The same goes for warehouse occupancy, freight cost per tonne and similar numbers: department heads need them for daily work. Management needs five numbers: three that say whether the chain works, and two that say whether it will still work a month from now.
Five questions for your business
- Do you measure OTIF against the date the customer requested, or against the date you confirmed yourselves?
- Do you know how many days your cash conversion cycle takes, and how much cash one day represents?
- Do you have express freight, rush deliveries and overtime due to delays collected in one place, or are they spread across department costs?
- Do you measure forecast accuracy by item and on the forecast that was valid one lead time earlier, or only on total revenue?
- Do you know which three suppliers are late most often, and how many of those delays are caused by your own orders with too short a lead time?
If you have no reliable answer to two or more of these, you are probably running your supply chain on gut feel, and the numbers serve reporting.
Where to start
Calculate all five KPIs for the last 12 months, by month, on one page. For OTIF use the customer's requested date, even if you have to find it in emails. For supply chain cost, go through the transport and overtime postings and mark everything that was urgent or unplanned. For forecast accuracy and supplier reliability it is enough to start with the twenty items and ten suppliers with the highest volume. The first look at five curves side by side usually shows where the chain is paying for decisions made elsewhere. From then on, one rule applies: whenever one KPI improves, always check what happened to the others.
The 96% and 78% example, the 2% and 40% forecast example and the value of one cycle day at €15 million revenue are illustrations with round numbers, not client data. The electronic components manufacturer’s figures come from case study CS02 and were measured on actual results. Metric definitions: ASCM CSCP learning material 2022 (SCOR model, APICS Dictionary, 16th edition).
Case study: Working capital (PDF) ↗
Inventory management: from master data to excess and obsolete materials
Why the warehouse fills up again after a one-off inventory write-off, and six steps that prevent it: master data, posting movements, cycle counting, BOM standards, S&OP and excess and obsolete stock.
Less inventory, more cash, but not more profit
Reducing inventory releases cash, but EBITDA usually falls in the year of the reduction. Three traps, a case from practice, a board table and six steps to keep the warehouse from filling up again.