
The bullwhip effect: what the AI stock sell-off means for suppliers
When the customer at the top of the chain slows down, orders at the bottom fall much further. How to check your exposure and prepare before it happens

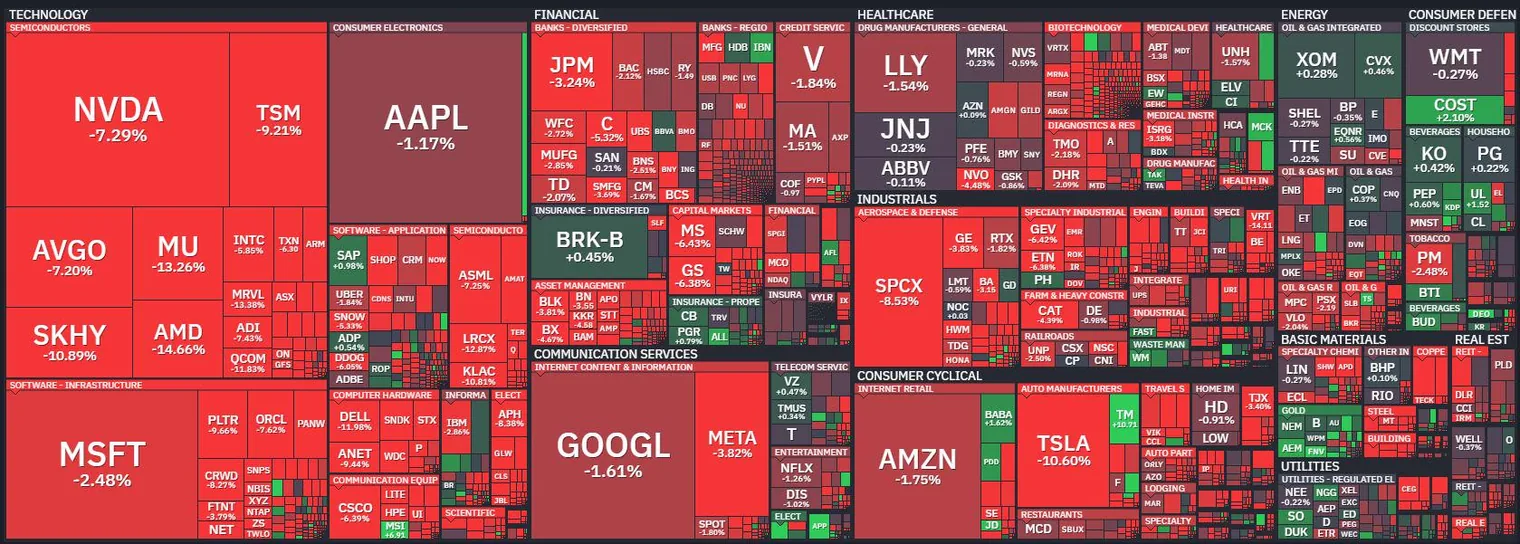
One day after rallying on the US midterm results, on 5 November 2026 the US stock market had one of its worst days in years. The Nasdaq fell 5.5% and slipped into correction, the S&P 500 lost 4.4%. The stocks that powered the AI boom fell hardest: Nvidia by 9.3%, the semiconductor index by more than 12%, some data centre operators by more than 14%. According to CNN, around $2.5 trillion of market value disappeared.
The reason was not that nobody needs artificial intelligence any more. After the US midterm elections, it became more likely that data centre construction will be slowed by tighter rules on electricity use, construction and permits. The market now expects the buildout to be slower and more expensive than it had assumed. Models are built in weeks; power plants, transmission lines and data centres take years.
Why this is news for a factory with €30 million in revenue too
One day on the stock market is not a trend, and market analysts are often wrong. But the day showed something that holds in every supply chain: expectations at the top of the chain change in a day, while the consequences at the bottom last for months.
Behind a data centre stands a long chain of suppliers: electrical cabinets and switchgear, transformers, cables, cooling systems, steel structures, printed circuit boards, enclosures, and tooling for all of these. Many of these products or their parts are made by mid-sized European companies that do not necessarily know their product ends up in a data centre. They only see their customer's orders.
That is the trap. When the end customer slows down by a few percent, a supplier at the third or fourth tier does not feel it as a few percent, but as much more.
What the bullwhip effect is
The bullwhip effect is the way demand fluctuations grow as they travel from the end customer towards suppliers, just as a small flick of the wrist becomes a large swing at the end of a whip. Jay Forrester described it in Industrial Dynamics (1961); Hau Lee, V. Padmanabhan and Seungjin Whang gave it its name and explanation in 1997. They named four causes:
- Demand forecast updating. Each tier forecasts from its customer's orders, not from end consumption, and adds safety stock to the forecast.
- Order batching. Orders are collected into larger quantities, so the supplier sees surges instead of a steady flow.
- Price fluctuations. Discounts and expected price rises encourage buying for stock.
- Shortage gaming. When goods are scarce, customers order more than they need to get at least part. When the shortage ends, the orders vanish overnight.
We all saw the last one in 2021 and 2022 with electronic components: customers ordered years ahead, then had full warehouses, and orders collapsed. Data centre equipment has been a similar shortage market in recent years: long lead times, for transformers for example, reserved capacity and orders placed "just in case".
An illustrative calculation: how −5% becomes −45%
Take a simple three-tier chain with a single rule: each tier holds two months of its own demand in stock.
| Tier | Demand before | Demand now | Target stock | Order this month | Change |
|---|---|---|---|---|---|
| End customer | 100 | 95 | – | 95 | −5% |
| Supplier 1 | 100 | 95 | 200 → 190 | 95 − 10 = 85 | −15% |
| Supplier 2 | 100 | 85 | 200 → 170 | 85 − 30 = 55 | −45% |
End consumption fell by 5%. The first supplier cuts its orders by 15%, because it reduces its stock at the same time. The second supplier sees a 15% drop, reduces its own stock and orders 45% less. Nobody acted irrationally. Each simply followed its own stock rule.
The same happens in reverse when demand returns: the supplier at the end of the chain suddenly receives more orders than it can handle. That is why companies at the end of the chain swing between overloaded and idle capacity, even though end consumption changes only a little.
What this means for small and mid-sized companies
Small companies (up to €10m revenue). They are often at the third or fourth tier and have one or two large customers. The bullwhip hits them hardest, and they have the smallest reserves. The key question is cash: how many months can the business last if its main customer's orders fall by a third?
Mid-sized companies (€10–50m revenue). They have more customers, but often from the same industries. If the three largest customers all sell into the same end market, the business is not diversified, even with three customers. Here the key question is exposure by end market, not by customer.
Companies in a group. Orders often come through the parent company or a sister plant and are even further from end consumption. Local management sees the change last, so it needs its own early signals.
There is another side too. When the big players brake, capacity is freed, lead times shorten and some materials become cheaper. A company with scenarios ready can use this instead of reacting too late.
Five measures before the wave reaches you
1. Measure exposure by end market. For your 20 largest customers, write down which end market your product goes into: data centres, automotive, construction, energy. Add up the share of revenue. It often turns out that one market is bigger than anyone thought.
2. Separate orders from consumption. Ask key customers for data on their actual consumption and stock of your products, not just their orders. Where possible, agree on vendor-managed inventory (VMI) or a monthly forecast exchange. The more consumption you see, the less the whip hits you.
How to track delivery reliability and forecast accuracy is covered in Five supply chain KPIs: from the ASCM standard to the board meeting.
3. Build scenarios into the monthly plan. Instead of one plan, prepare three: a base case, orders down 20% and orders down 40% for the most exposed product group. For each, write down what you do with staff, shifts, purchasing and stock, and which value of which indicator triggers the decision.
How to prepare a monthly plan with scenarios and approve it at management level is something we will cover in an upcoming insight.
4. Check your purchasing commitments. Open purchase orders, minimum order quantities, annual contracts without cancellation options. When orders fall, these commitments are what fills the warehouse. In new contracts, negotiate for flexibility, even at a price a few percent higher.
5. Prepare cash, not just capacity. Find out which costs are fixed and which flex with volume, and how much cash is tied up in inventory and receivables. Keep the distinction clear: reducing inventory releases cash, it does not improve EBITDA. In the worse scenario, cash is what buys the business time.
A simple framework: early signals
| Signal | What it means | Action |
|---|---|---|
| Customer shortens its forecast horizon or stops sending it | uncertainty at the customer | talk to the customer's purchasing, check its stock |
| Orders fall faster than the customer's sales | customer is cutting stock | adjust the plan, not just the forecast |
| Your suppliers' lead times are shortening | the shortage is ending | reduce safety stock and open orders |
| Customers postpone or split confirmed orders | start of an inventory correction | activate the downside scenario |
| Competitors cut prices or offer shorter lead times | free capacity in the industry | check margin by product before following |
Five questions for your business
- Do you know what share of your revenue goes into the same end market, regardless of which customer orders?
- Do you see actual consumption and stock of your products at the customer, or only their orders?
- How many of your open purchase orders could you cancel or postpone within a week?
- Do you have a plan ready in case your largest customer's orders fall by 30%?
- How many months could the business last on the cash it has if that happened next month?
Where to start
This week, export the last 12 months of revenue by customer and assign an end market to each of the 20 largest. For the largest market, calculate what a 30% drop in orders would mean for inventory, staff and cash flow. If the result is not acceptable, you have the topic for your next management meeting.
Case study: Working capital (PDF) ↗
Inventory management: from master data to excess and obsolete materials
Why the warehouse fills up again after a one-off inventory write-off, and six steps that prevent it: master data, posting movements, cycle counting, BOM standards, S&OP and excess and obsolete stock.
Less inventory, more cash, but not more profit
Reducing inventory releases cash, but EBITDA usually falls in the year of the reduction. Three traps, a case from practice, a board table and six steps to keep the warehouse from filling up again.